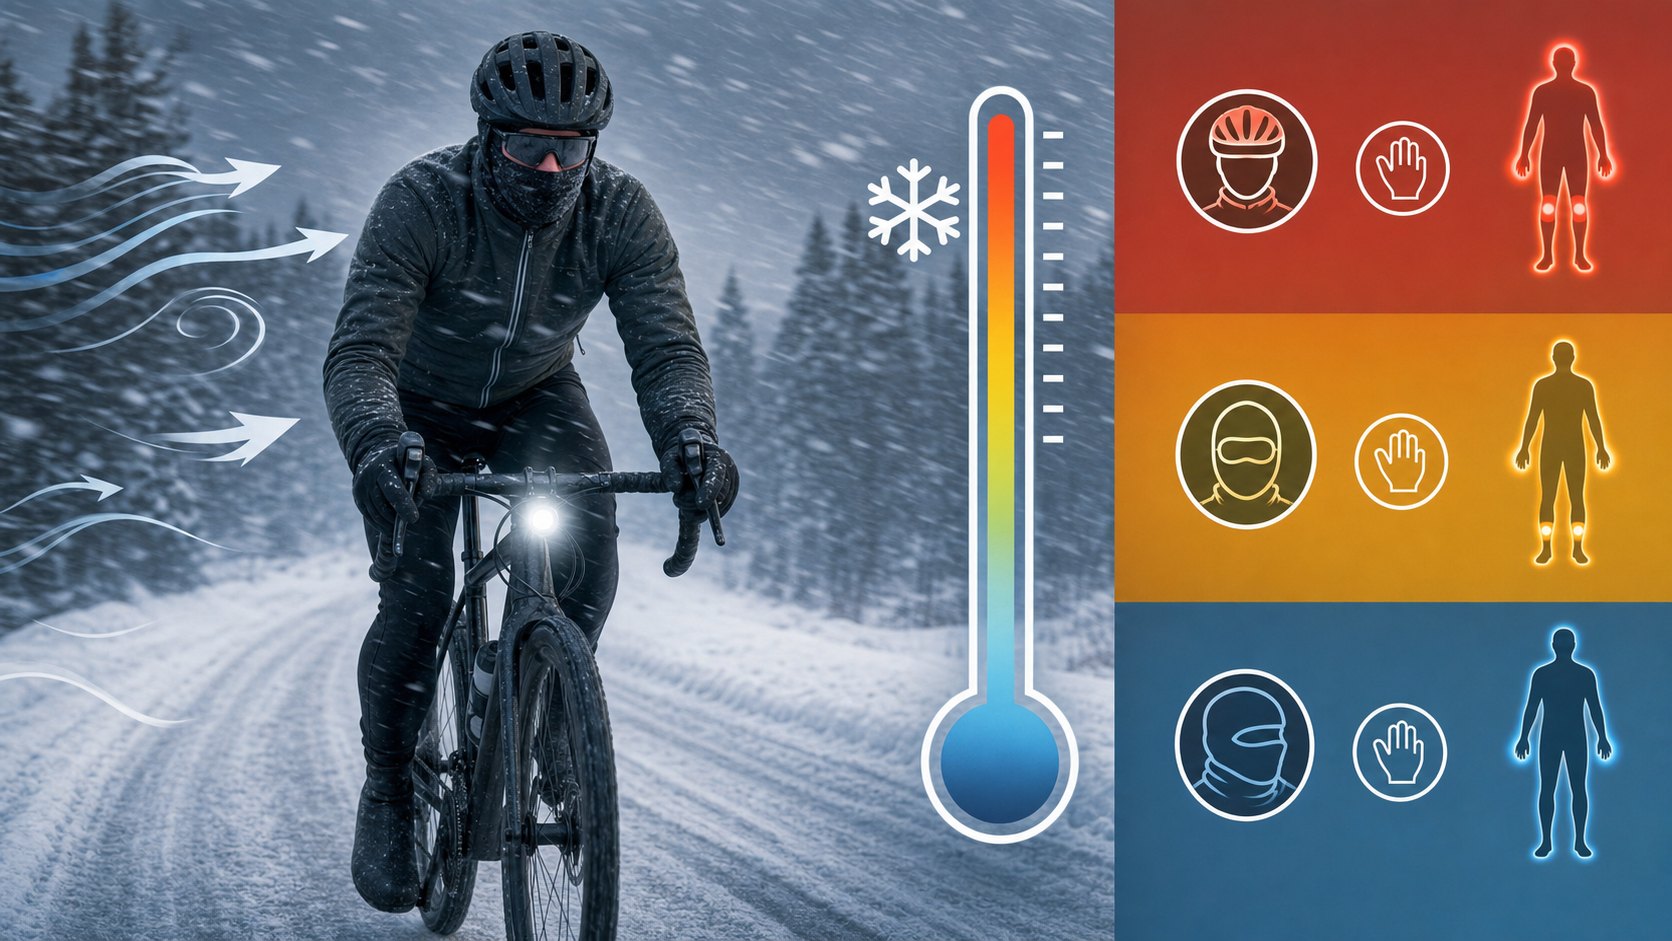
Read the Chart as an Exposed-Skin Warning, Not a Riding Permission Slip
Wind chill estimates how cold moving air feels on exposed skin. For cyclists, the useful takeaway is not just the chart number; it is whether your face, hands, feet, and wet clothing can stay protected for the ride length, route exposure, daylight, and emergency margin.
| What changes the risk | Why cyclists should care | Safer response |
|---|---|---|
| Riding speed plus natural wind | The body feels more moving air than the forecast wind alone. | Dress for the exposed part of the route, not the sheltered start. |
| Exposed skin | The chart is built around exposed-skin heat loss. | Cover cheeks, ears, fingers, and wrists before they go numb. |
| Sweat and stops | Wet layers cool quickly when effort drops. | Vent early, carry a dry layer, and avoid long exposed stops. |
| Mechanical delay | A flat or chain problem can turn a safe ride into a standing exposure problem. | Shorten the route when repair time would be dangerous. |
For ride planning, pair this chart with the winter cycling wind chill calculator, winter cycling clothes guide, and winter cycling gear guide.
Wind Chill Chart update: This page was refreshed on May 22, 2026 with a faster decision section, practical fit or safety checks, and clearer internal links for the next step.
How Cyclists Should Use a Wind Chill Chart
Wind chill matters more on a bike because your own speed adds to the air movement hitting your skin. Use the chart as a risk signal, then adjust layers, exposed skin, ride duration, and bailout options before the ride starts.
| Ride condition | What to check | Practical response |
|---|---|---|
| Cold but calm | Base layers and sweat control | Dress to stay warm without soaking yourself. |
| Cold and windy | Face, fingers, toes, and ears | Add windproof coverage and shorten exposure. |
| Long descent or open road | Higher apparent wind speed | Carry an extra shell or warmer gloves. |
| Deep cold | Skin exposure and return route | Plan a short loop with a safe exit. |
What matters most in wind chill for cyclists?
The most important wind chill factor for cyclists is exposed skin. A jacket can protect your torso, but fingers, toes, ears, cheeks, and nose often get cold first. Cover those areas before adding bulky layers everywhere else.
For clothing help, read the winter cycling clothes guide and the winter cycling gear guide.
Note that bike speed into still air is the same as wind speed. Cyclists are often moving at 15mph even on very cold days. A quick glance at the chart below indicates that you loose heat at a rate that seems much colder than the outside temperature.
| 30 | 25 | 20 | 15 | 10 | 5 | 0 | -5 | -10 | -15 | -20 | -25 | |
|---|---|---|---|---|---|---|---|---|---|---|---|---|
| 5 | 25 | 19 | 13 | 7 | 1 | -5 | -11 | -16 | -22 | -28 | -34 | -40 |
| 10 | 21 | 15 | 9 | 3 | -4 | -10 | -16 | -22 | -28 | -35 | -41 | -47 |
| 15 | 19 | 13 | 6 | 0 | -7 | -13 | -19 | -26 | -32 | -39 | -45 | -51 |
| 20 | 17 | 11 | 4 | -2 | -9 | -15 | -22 | -29 | -35 | -42 | -48 | -55 |
| 25 | 16 | 9 | 3 | -4 | -11 | -17 | -24 | -31 | -37 | -44 | -51 | -58 |
| 30 | 15 | 8 | 1 | -5 | -12 | -19 | -26 | -33 | -39 | -46 | -53 | -60 |
| 35 | 14 | 7 | 0 | -7 | -14 | -21 | -27 | -34 | -41 | -48 | -55 | -62 |
| 40 | 13 | 6 | -1 | -8 | -15 | -22 | -29 | -36 | -43 | -50 | -57 | -64 |
| 45 | 12 | 5 | -2 | -9 | -16 | -23 | -30 | -37 | -44 | -51 | -58 | -65 |
| 50 | 12 | 4 | -3 | -10 | -17 | -24 | -31 | -38 | -45 | -52 | -60 | -67 |
| 55 | 11 | 4 | -3 | -11 | -18 | -25 | -32 | -39 | -46 | -54 | -61 | -68 |
| 60 | 10 | 3 | -4 | -11 | -19 | -26 | -33 | -40 | -48 | -55 | -62 | -69 |
While cycling in 40 degree still air, at 15 mph, it will feel like 23 degrees, or 9 degrees below freezing. Does this mean you could get frostbite at 40? No. But you will cool down at the same rate that you would if it really were 23 degrees, you will never get colder than it really is.
The wind-chill temperature is a measure of relative discomfort due to combined cold and wind. It was developed by Siple and Passel (1941) and is based on physiological studies of the rate of heat loss for various combinations of ambient temperature and wind speed.
The wind-chill temperature equals the actual air temperature when the wind speed is 4 mph or less. At higher wind speeds, the wind-chill temperature is lower than the air temperature and measures the increased cold stress and discomfort associated with wind.
The formula the U.S. National Weather Service uses to compute wind chill is:
T(wc) = 0.0817(3.71V**0.5 + 5.81 -0.25V)(T – 91.4) + 91.4
T(wc) is the wind chill, V is in the wind speed in statute miles per hour and T is the temperature in degrees Fahrenheit.
The formula to calculate a Celsius wind chill using V as the wind speed in kilometers per hour and T in degrees Celsius is:
T(wc) = 0.045(5.27V**0.5 + 10.45 – 0.28V) (T – 33) + 33
The effects of wind-chill depend strongly on the amount of clothing and other protection worn as well as on age, health, and body characteristics. Wind-chill temperatures near or below 0 F indicate that there is a risk of frostbite or other injury to exposed flesh. The risk of hypothermia from being inadequately clothed also depends on the wind-chill temperature.
Icebikers always have wind-chill to deal with. Even on Calm days!
Second Opinion
There are some doubts about the accuracy and usefulness of the wind-chill chart. First, the table seems to suggest that standing out in a 20 mph wind on a 40 degree day would yield a temperature of about 10 degrees below freezing. Clearly that’s not the case. You can’t get frost bitten unless the temperature is at or below freezing. Wind chill only measures how fast exposed flesh will lose heat, not how cold (that temperature) that flesh will chill to.
Wind-chill reports tend to exaggerate the actual rate at which you feel cold. The reports end up being discounted by most people who have experience in cold weather because it does not tend to agree with personal experience.
The US weather service is thinking about revising the wind chill chart, perhaps by adopting the Canadian standard (below). That standard is still not accepted by the public, because its very difficult to judge the feeling of a watt per square meter. Consequently, most weather reports simply convert the official measurement to something easier to understand – back to the old wind chill chart.
There are several good resources on wind chill. USA Today (of all places) had a fairly good write up on this subject.

More Technical
The explanation of wind-chill above are subjective measures of relative discomfort. As such they are at best a guide, and can often lead to the misconception that you can get frost-bitten if the temperature is above freezing but the wind chill is below freezing.
Environment Canada publishes the chart below as the preferred method of measuring wind chill. This chart expresses wind-chill as a rate of heat loss, something that can be measured precisely rather than a perception.
Windchill Equivalent Temperature
| 0 | -5 | -10 | -15 | -20 | -25 | -30 | -35 | |
|---|---|---|---|---|---|---|---|---|
| 10 | -2 | -7 | -12 | -17 | -22 | -27 | -32 | -38 |
| 20 | -7 | -13 | -19 | -25 | -31 | -37 | -43 | -50 |
| 30 | -11 | -17 | -24 | -31 | -37 | -44 | -50 | -57 |
| 40 | -13 | -20 | -27 | -34 | -41 | -48 | -55 | -62 |
| 50 | -15 | -22 | -29 | -36 | -44 | -51 | -58 | -66 |
| 60 | -16 | -23 | -31 | -38 | -45 | -53 | -60 | -68 |
Windchill factor
| 0 | -5 | -10 | -15 | -20 | -25 | -30 | -35 | |
|---|---|---|---|---|---|---|---|---|
| 10 | 933 | 1075 | 1216 | 1358 | 1499 | 1641 | 1782 | 2009 |
| 20 | 1092 | 1257 | 1423 | 1588 | 1753 | 1919 | 2084 | 2248 |
| 30 | 1189 | 1369 | 1549 | 1729 | 1909 | 2089 | 2269 | 2449 |
| 40 | 1253 | 1443 | 1633 | 1823 | 2013 | 2202 | 2393 | 2583 |
| 50 | 1298 | 1494 | 1691 | 1887 | 2084 | 2280 | 2477 | 2673 |
| 60 | 1327 | 1529 | 1730 | 1931 | 2132 | 2334 | 2535 | 2736 |

2 thoughts on “Wind Chill Chart for Winter Cyclists and Ice Bikers”
Does anyone know how to predict the rate at which we lose body heat to keep a safe zone to avoid hypothermia? Is there an easy way to calculate this in my head while riding?
Thanks a lot for your comment, but must confess that I have never seen such a calculation 🙁